This app will perform computer simulations to estimate the power of the t-test for the Pearson bivariate correlation under the assumption that the data are continuous and either bivariate normally distributed or non-normally distributed. To see why this is important, please check out this blog post.
It is very straightforward to use. When you click on the app, it will look like this:
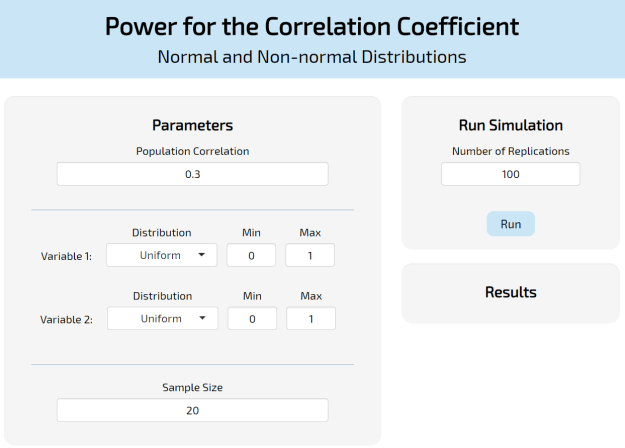
What *you*, the user, needs to provide it with is the following:
The population correlation (i.e., the effect size) for which you would like to obtain power. The default is 0.3
The type of distributions you would like to correlate together. Right now it can handle the chi-square distribution (where skewness is controlled through the degrees of freedom), the uniform distribution (to have a symmetric distribution with negative kurtosis) and the binomial distribution where one can control the number of response categories (size) and the probability parameter. This will soon be replaced by a multinomial distribution so that the probability of every marginal response option can be specified.
The sample size. The default is 20
The number of replications for the simulation. The default is 100.
Now, what is the app actually doing? It runs R underneath and it is going to give you the estimated power of the t-test under both conditions. The first one is calculated under the assumption that your data are bivariate normally distributed. This is just a direct use of the pwr.r.test function of the pwr R package. Should give you answers very close or exactly the same as G*Power. I chose to use it for sake of comparison.
What comes out is something that looks like this:
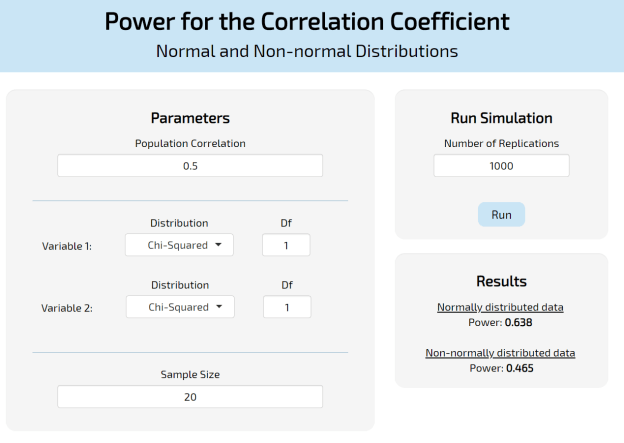
So, on top, you’re going to get the power as if you were using G*Power (or the pwr R package) which is exact and needs no simulation because we have closed-form expressions for it. On the bottom you are going to get the approximated power using simulations. Remember, when working with non-normal data you can’t always expect power to be lower, as in this case. Sometimes it may be higher and sometimes it won’t change much. Yes, at some point (if your sample size is large enough) the distribution of your data will matter very little. But, in the meantime, at least you can use this one to guide you!
Finally, here’s the link for the shiny web app:

You must be logged in to post a comment.